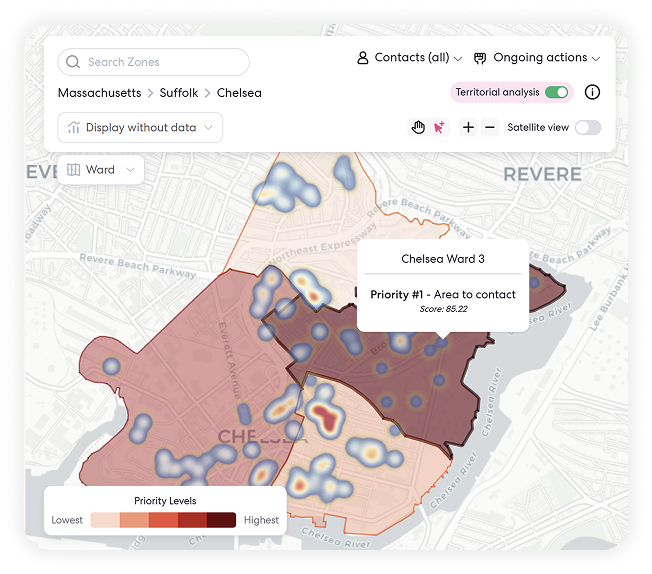
Territorial Analysis helps you compare and prioritize geographic areas based on the criteria that matter most to you - whether its turnout, population density, or other variables.
Recently, we rolled out a behind-the-scenes improvement to the way Qomon computes territory scores. It’s subtle - you might not even notice it at first - but it makes the math that powers your analysis more stable, consistent, and reliable.
Why We Updated the Scoring Logic
In the past, a territory’s score could shift depending on which other territories were included in the comparison.
For example, looking at a region versus a county could yield slightly different results. That’s because scores were calculated differently depending on which level you were viewing.
With the new approach, each territory has a stable score, no matter where you view it from.
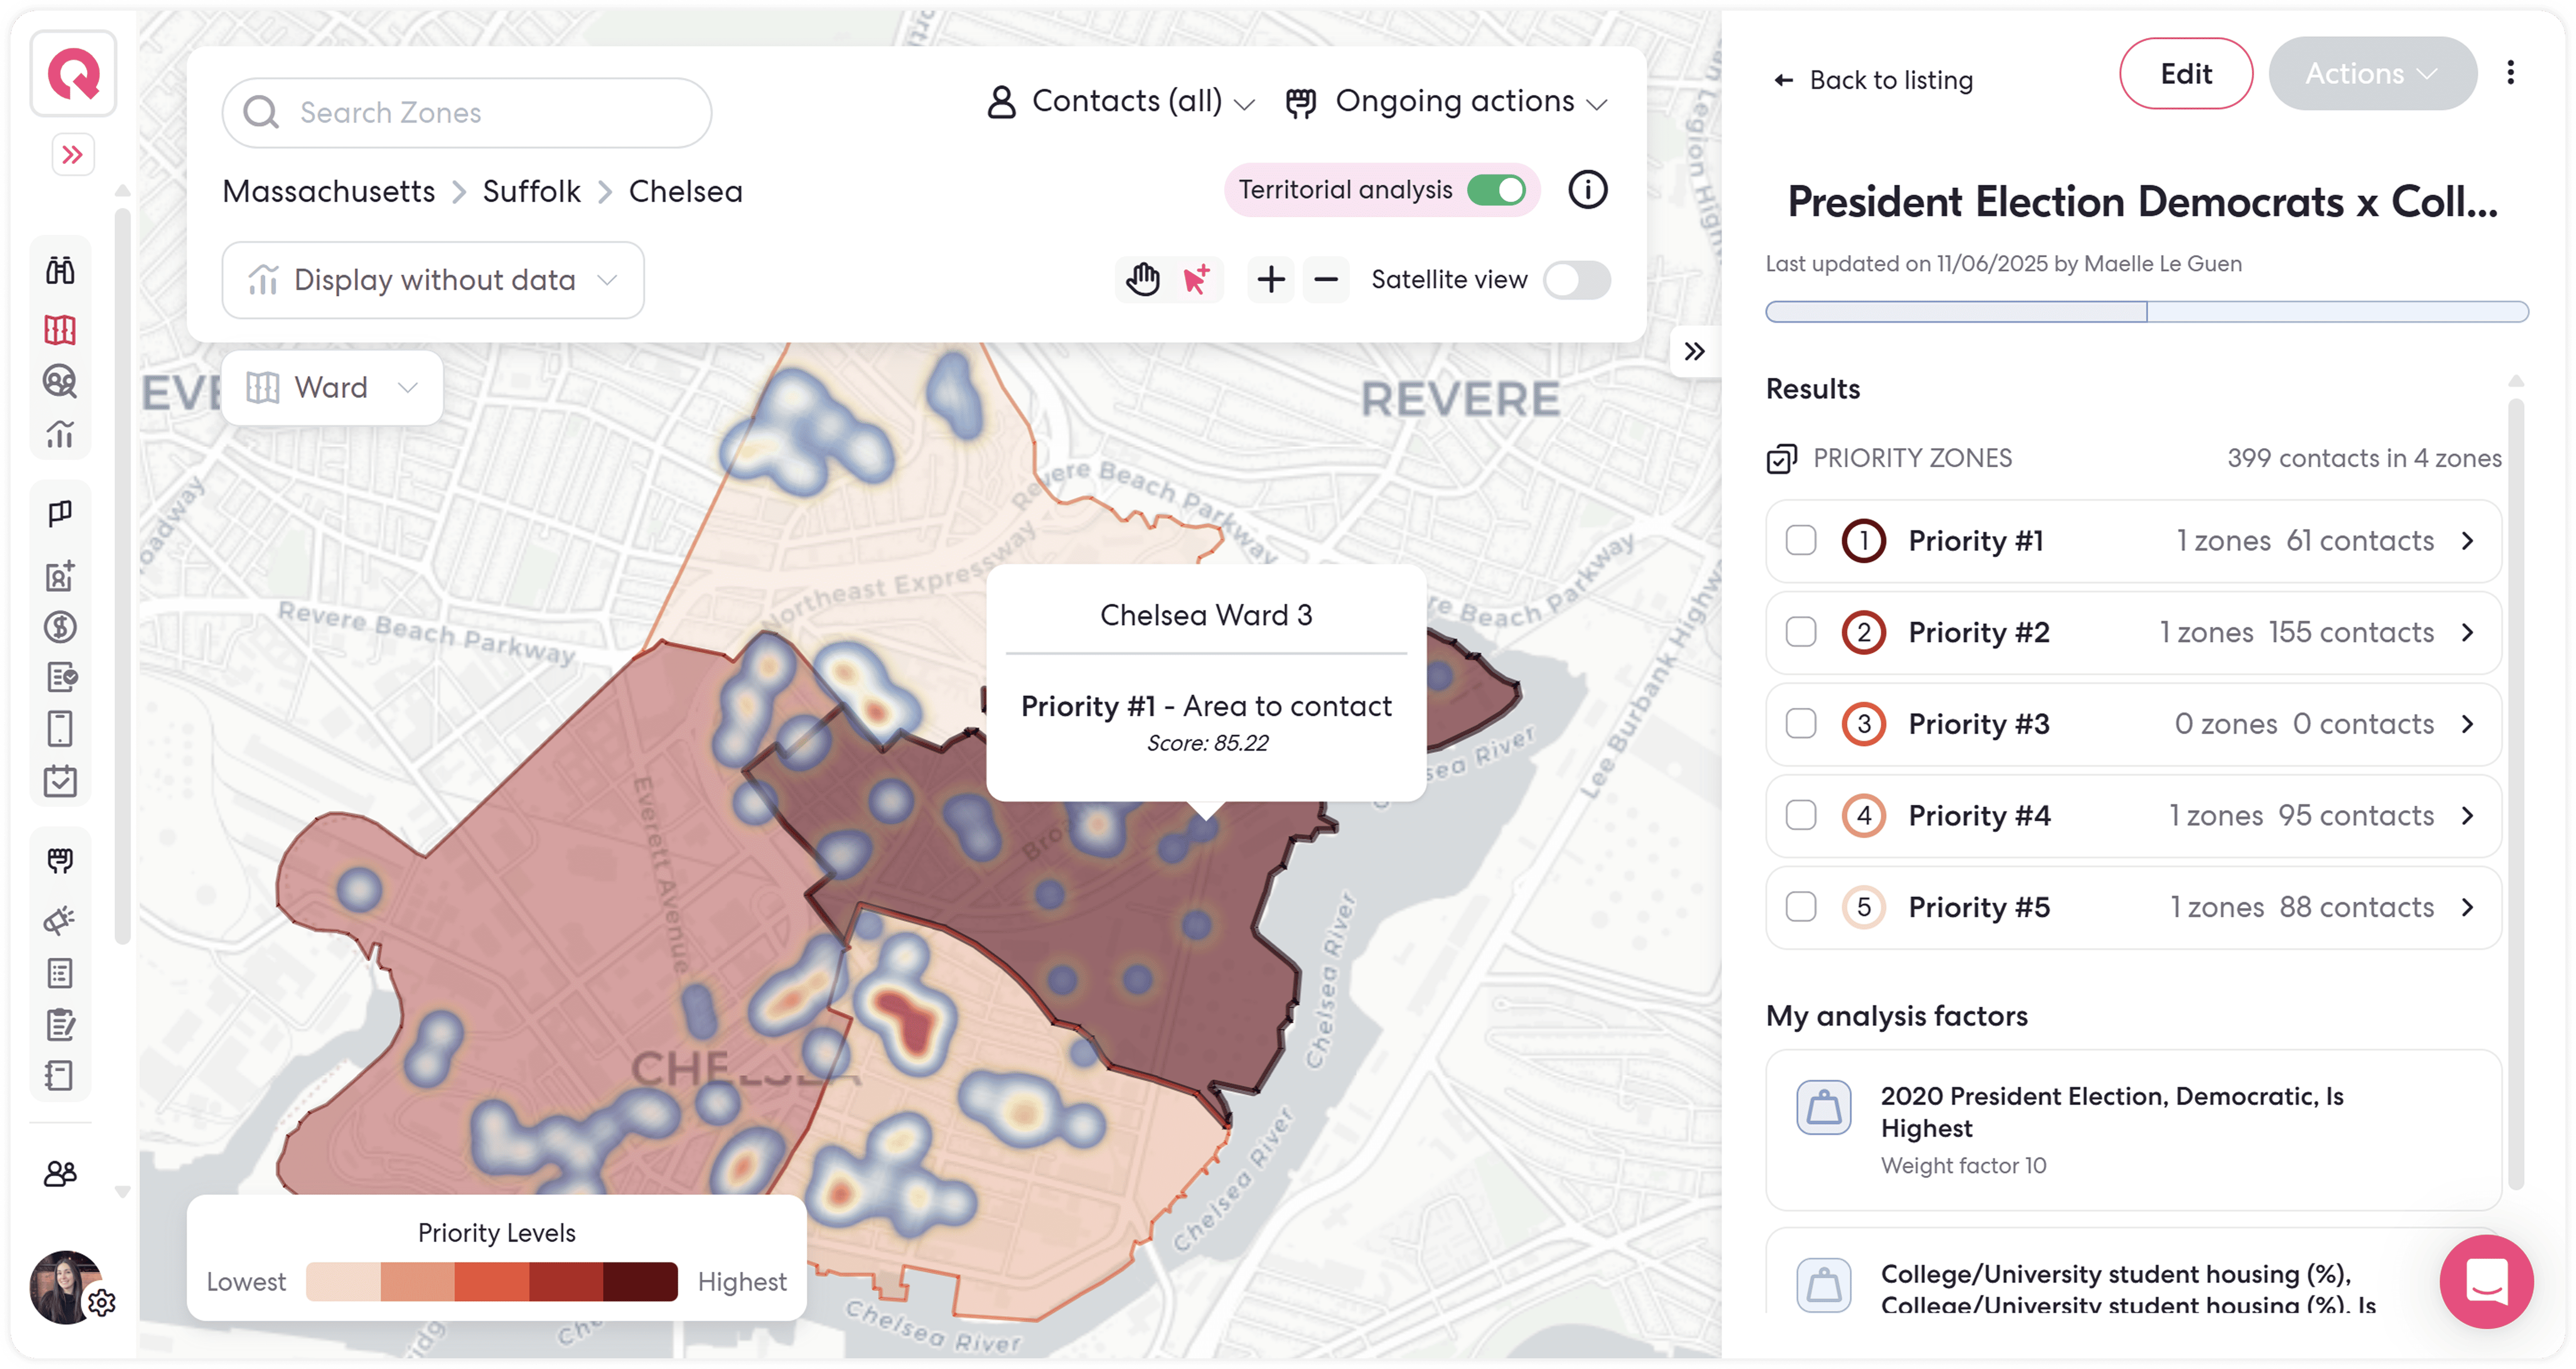
Priority zones (1-5) can still change because they are local buckets: top 20% = Priority 1, bottom 20% = Priority 5.
This gives Qomon more flexibility to reuse these scores across the platform and power future features.
What Changed (in Plain Language)
Qomon now compares territories based on how they rank relative to others, based on a new quantile normalization. Here’s how it feels from the user side:
- Zones and regions get ranked more consistently
- Priority zones still adapt to the area you’re analyzing (Priority 1-5 is always relative to the current view)
- Scores don’t jump around when you change filters or zoom in/out
- Count-type data (like totals and populations) no longer create bias in the scoring, and we’re working on enabling them in the Cross Analysis variable selection in the coming weeks.
What You Can Expect in Your Workflow
Nothing about how you run the analysis changes, you still:
- Select your criteria and assign weights
- Apply filters, like support > 70%
- View results on the map and in lists
- Prioritize where to act next
But the scoring behind those results is now more reliable, so priority rankings are more consistent and easier to trust.
Why This Matters for Your Strategy
Stable scores unlock future capabilities, including:
- The ability to reuse a reference score across features
- More accurate insights from the Map Data Explorer
- Better integration of all kinds of data variables
Even now, this change sets the stage for richer insights without requiring you to learn new concepts or tools.
A Better Foundation for Better Decisions
At Qomon, we build features that help organizations act with confidence. Improved scoring is one of those invisible improvements that pays off every time you run a new analysis, tweak criteria, or plan your next outreach.